San Antonio Cost of Living 2026: The Most Affordable Major Texas Metro — By the Numbers
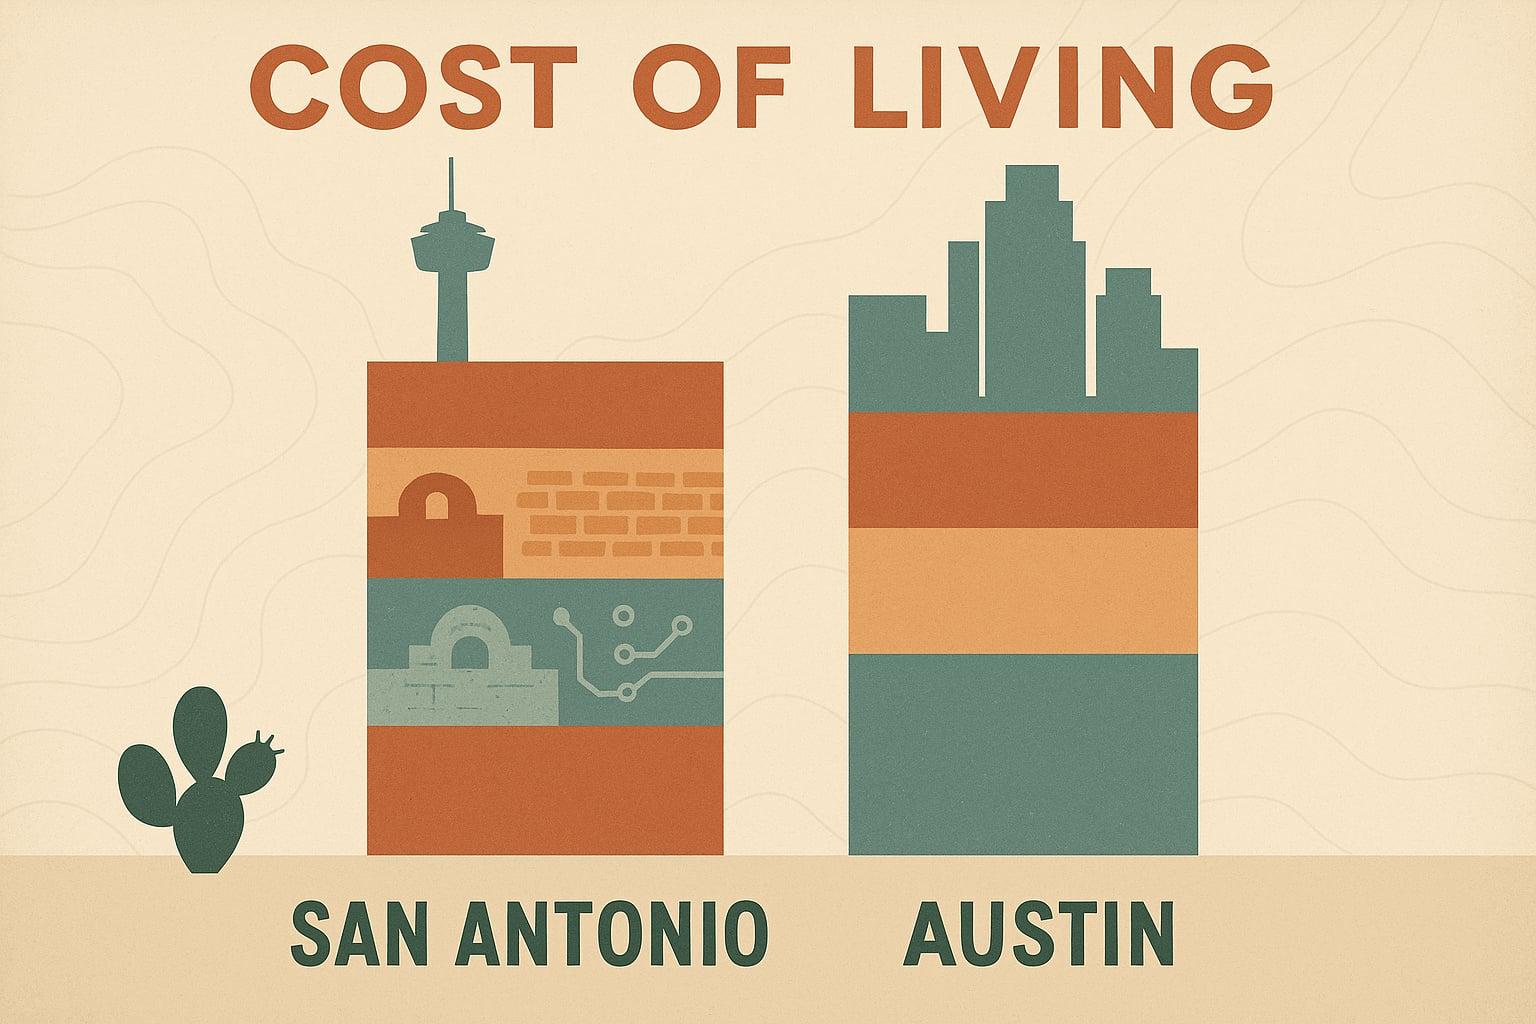
If you're stacking up Texas metros on a spreadsheet, the number that ends the argument is San Antonio's C2ER cost-of-living index: roughly 91 out of a national baseline of 100. That means daily life in San Antonio runs about 9% cheaper than the U.S. average, and cheaper still against every other major Texas city.
That's the Pragmatist's number. The lifestyle half of this decision has its own case to make, and it holds up just as well.
The Cheapest Major Texas Metro, Full Stop
The Council for Community and Economic Research (C2ER) publishes quarterly cost-of-living data for hundreds of urban areas. San Antonio scores around 91 overall, meaning costs run about 9% below the national average. (Source: C2ER/RentCafe, March 2026) San Antonio's index has consistently registered at or near the lowest reading among Texas's four largest metros across recent quarters.
For context: a $75,000 salary in Austin is roughly equivalent to $60,000 to $63,000 in San Antonio based on 2026 data. (Source: LRG Realty, 2026) That's not a rounding error. It's a meaningful lifestyle gap that shows up in your first month's bank statement.
The Rent Gap Is More Than $3,800 a Year
The sharpest edge of San Antonio's advantage is in rentals. Median one-bedroom rents in San Antonio average around $1,095, compared to roughly $1,417 in Austin, a gap of approximately $322 per month, or more than $3,800 per year. (Source: RentCafe/Yardi Matrix, July–August 2026) That's a car payment. It's a vacation. It's the beginning of a down payment fund.
For the Dreamer in the room: that monthly cushion buys real breathing room to explore the city. The River Walk, the Pearl District, and the Mission Trail are all free or low-cost on the weekends. San Antonio's dining scene (anchored by H-E-B's pantry-perfect grocery prices and a deep Tex-Mex tradition) runs well below what comparable evenings cost in Austin or Dallas.
If you want to test the city before committing, explore San Antonio neighbourhoods on Airbnb to get a feel for different pockets before signing a lease.
Home Prices: What the Gap Looks Like at the Closing Table
San Antonio's median home price ranges from roughly $251,000 to $265,000 depending on the data source, approximately 37–43% below Austin's metro-wide median of approximately $425,000–$440,000, and meaningfully below Dallas as well. (Sources: Redfin, Zillow ZHVI, mid-2026; Unlock MLS/KXAN July 2026 for Austin metro) That spread doesn't narrow much when you account for down payment requirements and monthly debt service.
For buyers working through affordability math, the San Antonio housing market data page has current price trends and permit volumes you can track alongside your search.
The supply picture supports buyers right now. The availability of homes in the San Antonio–New Braunfels metro has risen into buyer-friendly territory. That means negotiating room on price, seller concessions, and rate buydowns is real, not theoretical.
Why the Affordability Is Sustainable
Some cities are cheap because demand is weak. San Antonio is not that city.
Joint Base San Antonio is the largest joint base in the Department of Defense by personnel and economic impact. (Source: mybaseguide.com) That federal anchor means a portion of local demand is essentially recession-resistant: military and DoD contractor households don't relocate on a whim.
Beyond the base, San Antonio has the second-largest concentration of cybersecurity professionals in the United States outside of Washington D.C., home to a dense cluster of defense contractors and cyber firms. Major defense contractors and professional services firms actively recruit here, drawn by the density of DoD cyber work and cleared personnel. Port San Antonio (built on the former Kelly AFB site) has expanded into robotics and advanced manufacturing, adding a civilian cluster to the federal demand base.
The metro's nonfarm payroll base held broadly steady through 2025 (FRED: SANSA175MFRBDAL), with the unemployment rate at 4.2% as of June 2026 (FRED: SANA748UR). Population has grown steadily year over year per Census estimates, a pace that keeps housing demand steady without the overheating Austin experienced.
Where to Look Inside the Metro
San Antonio's affordability isn't uniform across zip codes. Among the more affordable submarkets, the Far West Side, Northeast San Antonio, and the Converse/Live Oak corridor have consistently shown lower price-per-square-foot than the inner-ring or Pearl-adjacent neighborhoods, with access to strong school districts served by North East ISD and Judson ISD.
For families weighing school quality alongside price, the San Antonio school district ratings and relocation guide breaks down TEA performance data by district.
What the Numbers Mean for Pragmatists and Dreamers
For the Pragmatist: the numbers clear every bar. San Antonio's C2ER index sits 8–9% below the national average, home prices run roughly 37–43% below Austin's metro median, and the job market is built on federal contracts and cybersecurity demand, not a single employer or a speculative tech cycle. Home values have remained broadly stable, with most trackers showing modest year-over-year softening rather than runaway appreciation or distress.
For the Dreamer: this is a city with genuine character. The River Walk isn't a tourist trap you'll stop using after month two; locals actually eat there. The Pearl District has become a legitimate food and culture hub. The Alamo and Mission Trail give the city a historical backbone that most Sun Belt metros simply don't have. And the airport connects directly to most major hubs without the fare premiums Austin charges.
Run your numbers with a mortgage affordability calculator to see what a San Antonio price point does to your monthly payment at current rates. Then book a weekend and walk the Pearl. That combination (spreadsheet plus boots on the ground) tends to settle the decision fast.
This article was researched and drafted with AI assistance, fact-checked, and reviewed by an editor before publication — see our Editorial Standards. It is general information about real estate markets, not financial, investment, legal, or real estate advice; consult a licensed professional before acting. See our full disclosure.
More market analysis
Texas Just Cut Your Property Tax Bill: What Houston, Dallas, San Antonio, and Austin Homeowners Need to Know in 2026
4 min read
Houston vs. Dallas Cost of Living 2026: Jobs, Insurance, and What Relocators Actually Pay
4 min read
Atlanta Cost of Living 2026: What You'll Actually Pay for Housing, Insurance, Taxes, and Utilities
5 min read
Considering a move? Explore the full San Antonio market data — home prices, rents, jobs, permits, and population trends.
Beyond the calculator: see our full relocation toolkit — movers, agents, insurance, and city-test rentals.