
Phoenix Housing Market, October 2026: Mortgage Rates Reach 7.40% as Home Values Slip 1.1%
Rates reached 7.40% as Phoenix home values slipped 1.1%. See what that adds to the payment on a $440,821 home and how to negotiate it back.
4 min read
For the mover who wants the numbers — and the partner who needs the feel. FRED-grounded market data for the Pragmatist, neighbourhood and lifestyle coverage for the Dreamer — across 12 metros from Phoenix to Raleigh.
Get the weekly digest — market data every Friday, free.
By subscribing you agree to our Privacy Policy. Unsubscribe anytime.
Primary data sources: FHFA HPIU.S. Census BureauBureau of Labor StatisticsHUD Fair Market Rentsretrieved via FRED and FHFA
Public-domain housing market data for twelve of the fastest-growing metros in America.
Atlanta
GA
$1,820/mo
2BR Fair Market Rent · HUD FY2026
Austin
TX
$1,852/mo
2BR Fair Market Rent · HUD FY2026
Charlotte
NC
$1,686/mo
2BR Fair Market Rent · HUD FY2026
Dallas-Fort Worth
TX
$1,931/mo
2BR Fair Market Rent · HUD FY2026
Houston
TX
$1,573/mo
2BR Fair Market Rent · HUD FY2026
Jacksonville
FL
$1,658/mo
2BR Fair Market Rent · HUD FY2026
Nashville
TN
$1,730/mo
2BR Fair Market Rent · HUD FY2026
Orlando
FL
$1,972/mo
2BR Fair Market Rent · HUD FY2026
Phoenix
AZ
$1,839/mo
2BR Fair Market Rent · HUD FY2026
Raleigh
NC
$1,750/mo
2BR Fair Market Rent · HUD FY2026
San Antonio
TX
$1,426/mo
2BR Fair Market Rent · HUD FY2026
Tampa
FL
$1,977/mo
2BR Fair Market Rent · HUD FY2026
HPI YoY: FHFA House Price Index, Q2 2026 vs. a year earlier. Atlanta: Atlanta-Sandy Springs-Roswell division. Dallas-Fort Worth: Dallas-Plano-Irving division. Tampa: Tampa division.
12
Metros tracked
+1.0%
Avg HPI YoY change (Q2 2026)
+1.48%
Avg population growth (YoY, 2025)
4.2%
Avg unemployment rate (Jul 2026)
Averaged across 12 tracked metros (Tampa home prices: Tampa division; Dallas-Fort Worth home prices: Dallas-Plano-Irving division; Atlanta home prices: Atlanta-Sandy Springs-Roswell division) · Sources: FHFA, U.S. Census Bureau, BLS — retrieved from FRED, Federal Reserve Bank of St. Louis, and FHFA
Compare tool
Side-by-side market data, migration signals, and lifestyle notes for every pair of Sun Belt metros — built for couples weighing two different shortlists.
Sources: FHFA, Census, BLS, HUD · refreshed monthly
More comparisons
See allDeep dives into Sun Belt market data, trends, and opportunity.
Rates reached 7.40% as Phoenix home values slipped 1.1%. See what that adds to the payment on a $440,821 home and how to negotiate it back.

Nashville violent crime fell 16.7% and Charlotte overall crime fell 16% in the first half of 2026. What the police data can and can't tell you.

Jacksonville's Duval County Citizens insurance average is falling in 2026. Here's how flood risk shapes your real budget.
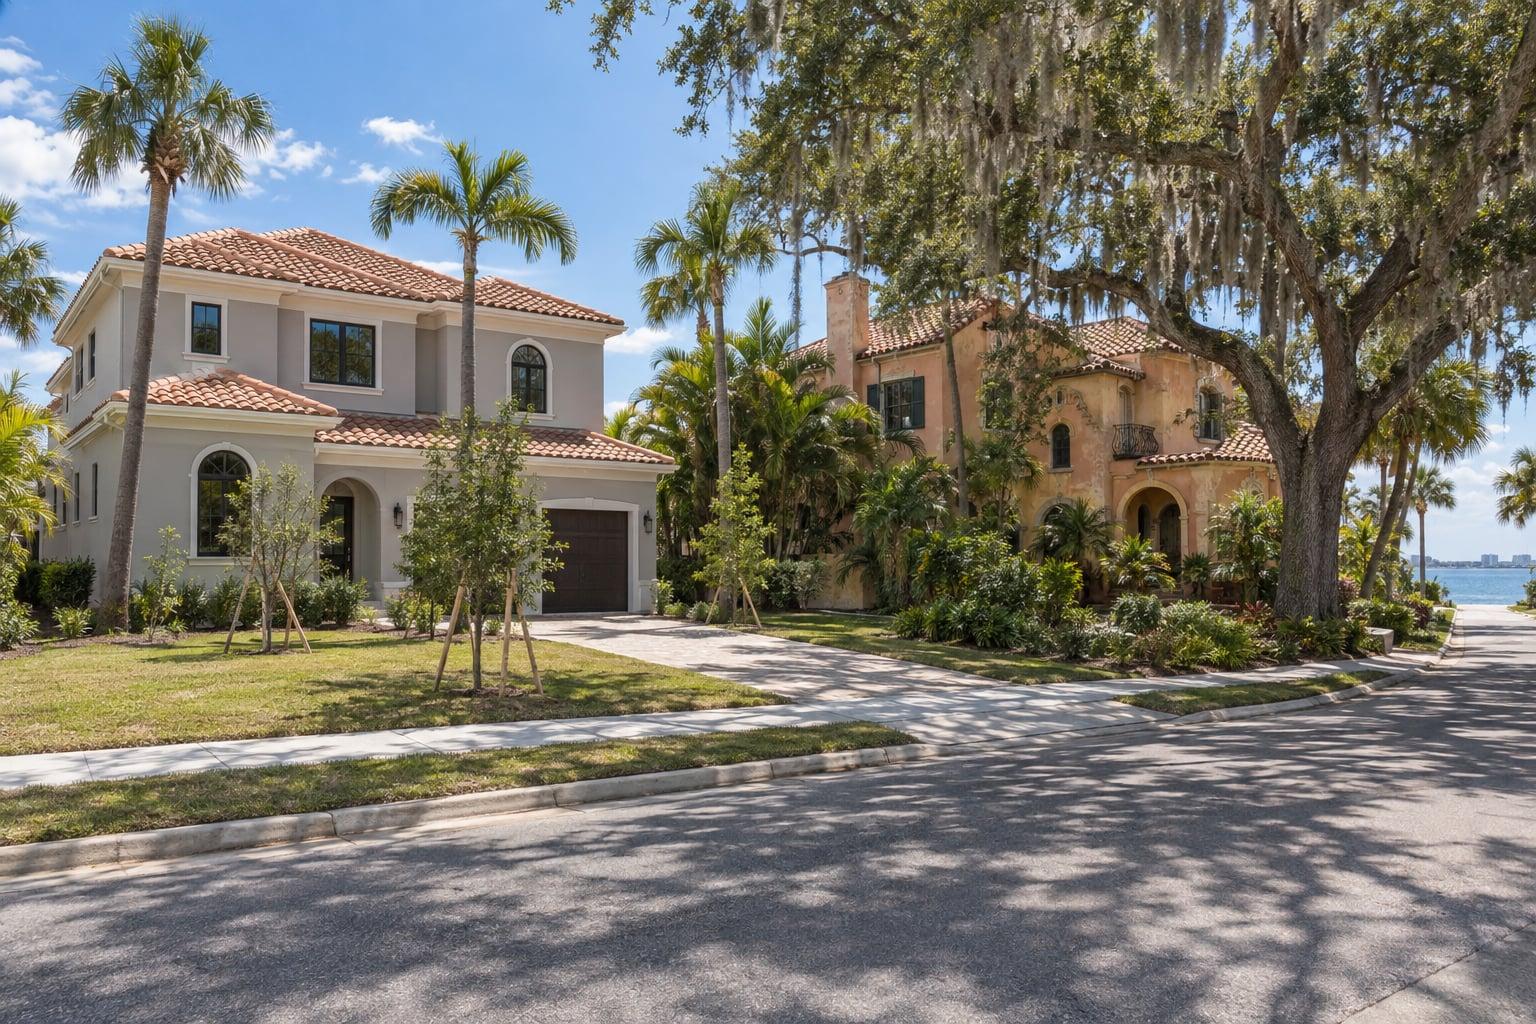
Tampa new builds sold for $198/sq ft vs $226 for resale in July 2026, per Zillow, roughly $56,000 less on a 2,000 sq ft home by our math.

U-Haul's 2026 midyear data puts DFW, Houston and Orlando atop millennial moves, while Census shows North Carolina gaining 84,064 domestic movers.
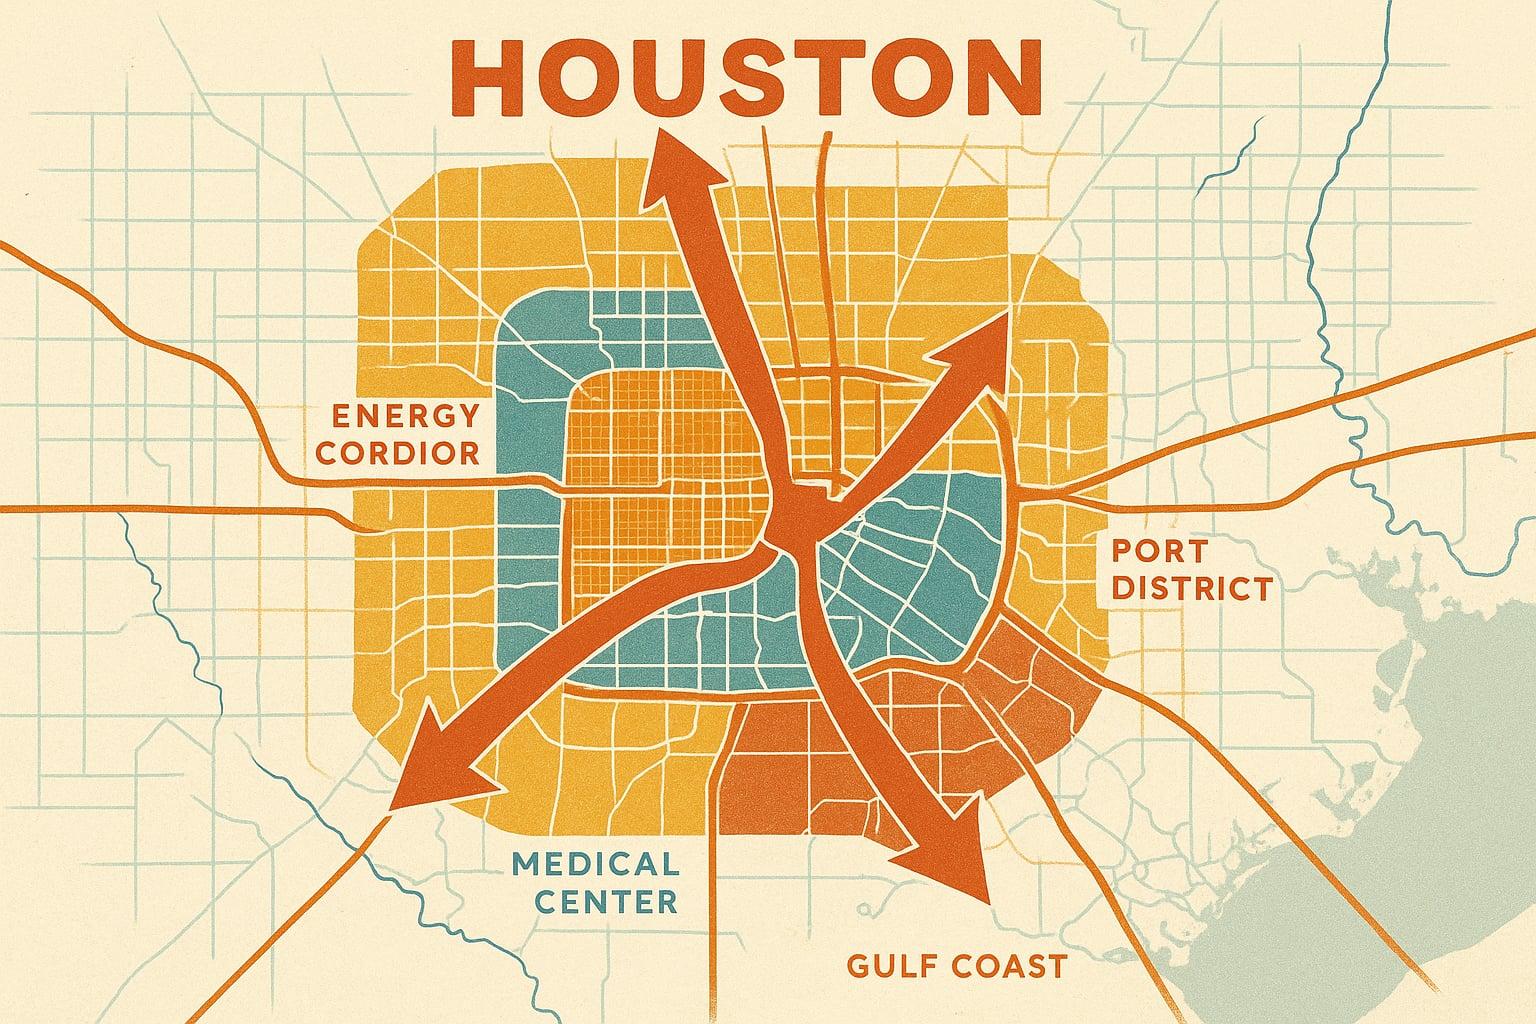
Houston added 44,700 jobs in the year to August 2026, more than any other U.S. metro. Here's which sectors are hiring and what that means for a move.
Tools & resources
Our relocation toolkit covers mortgage rates, movers, agents, insurance, and city-test rentals across 12 Sun Belt metros.