Austin's Two-Speed Construction Market: Travis County Grows While Suburbs Pull Back in 2025
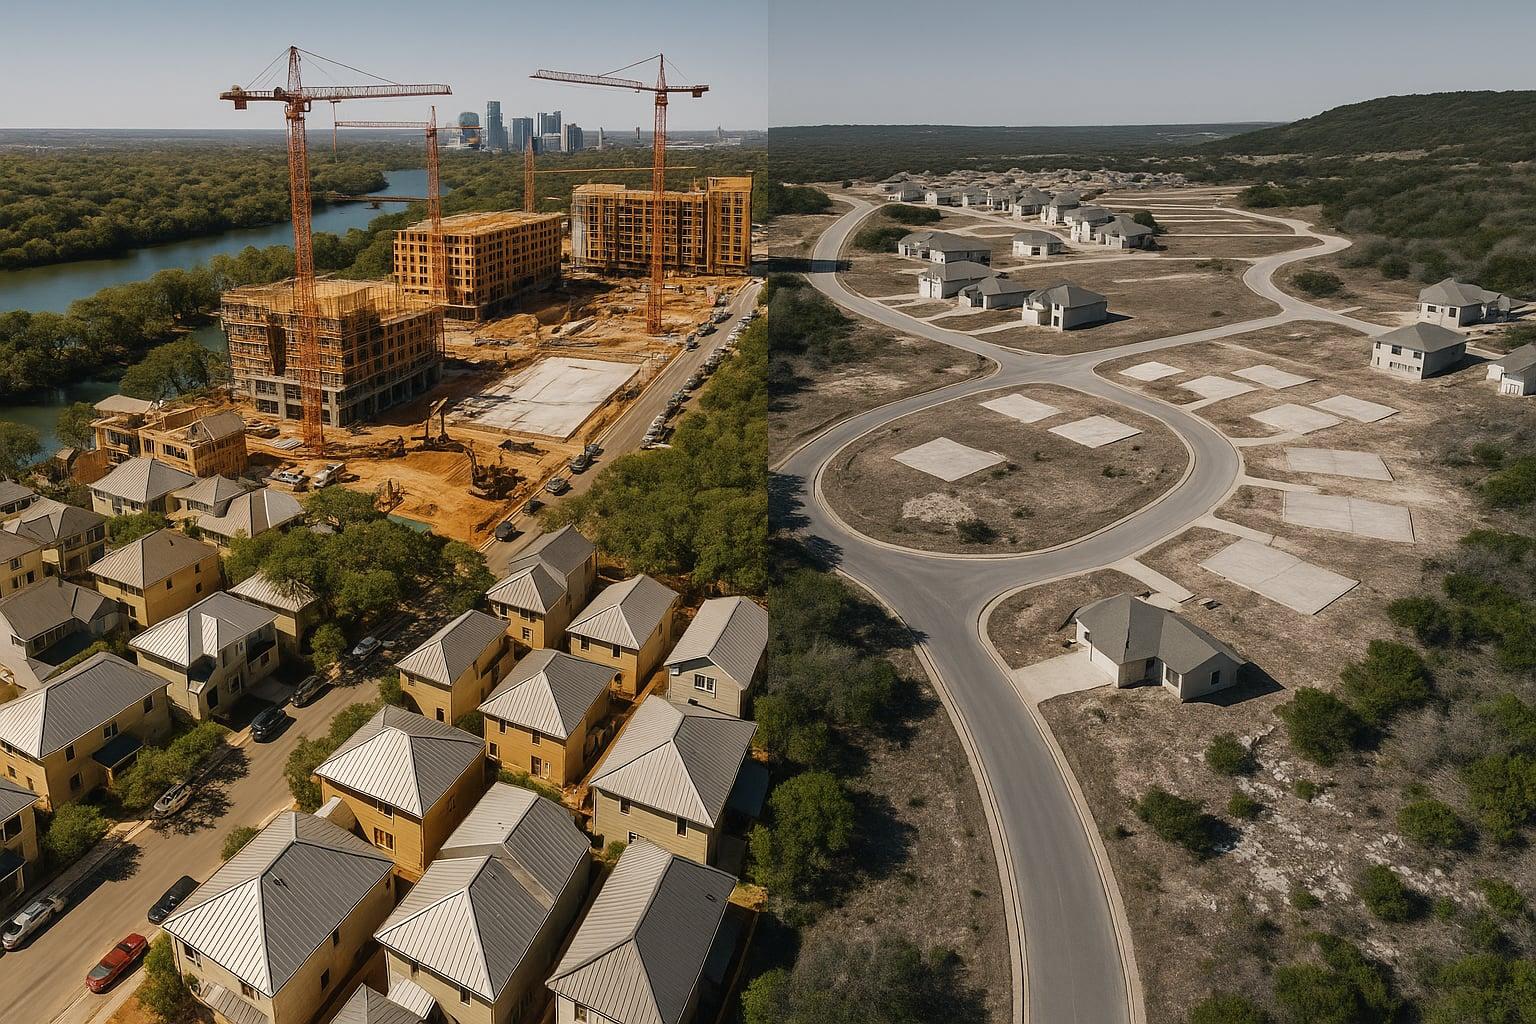
Travis County posted 5% permit growth in 2025 while Austin's suburbs pulled back — a two-speed construction market reshaping the metro's price map.
Data-driven reporting on Sun Belt real estate markets, migration trends, and investment opportunities.
Latest

Travis County posted 5% permit growth in 2025 while Austin's suburbs pulled back — a two-speed construction market reshaping the metro's price map.

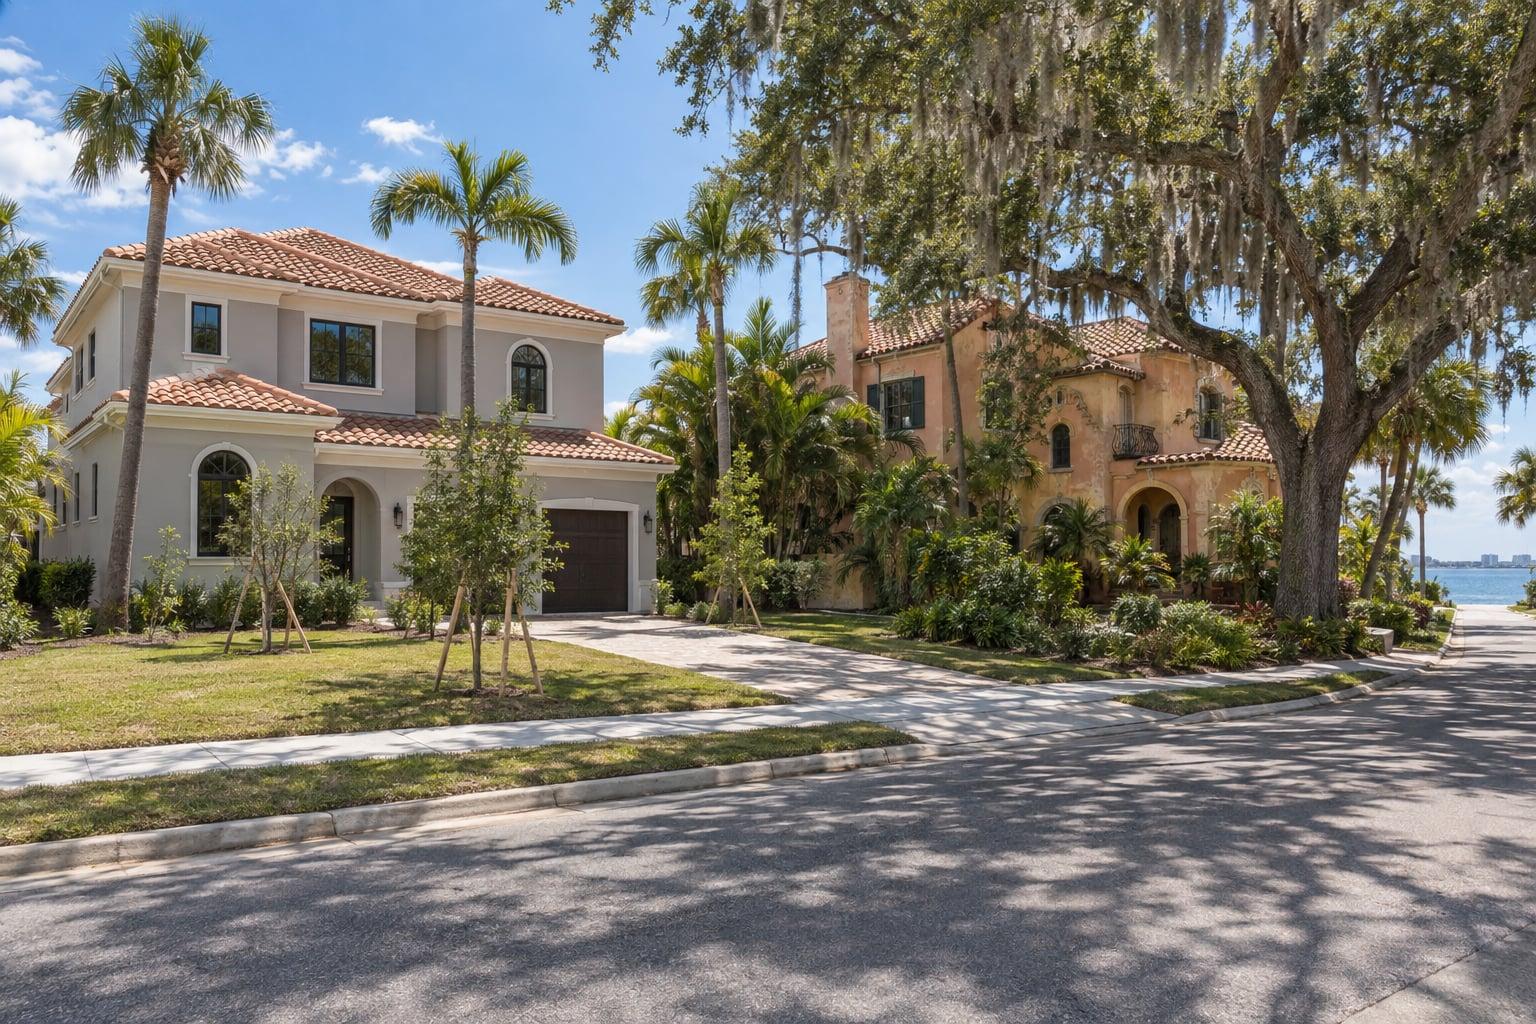
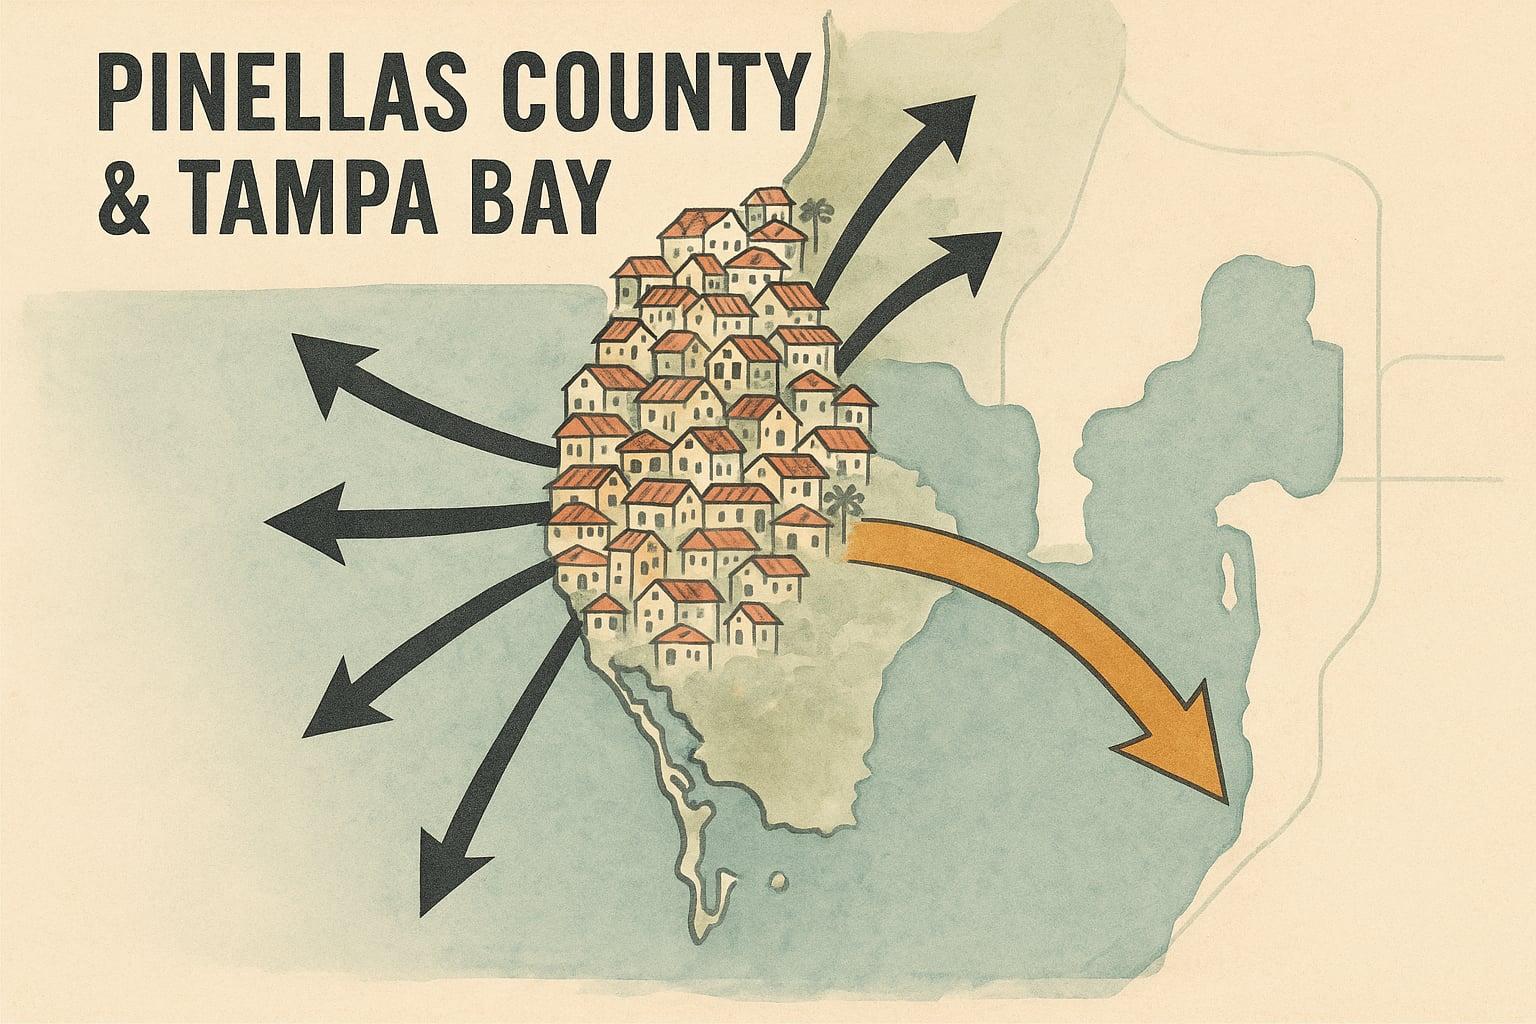
Pinellas County shed nearly 11,900 residents in 12 months — second-worst in the U.S. Here's whether that signals a Tampa buyer opportunity or a warning sign.

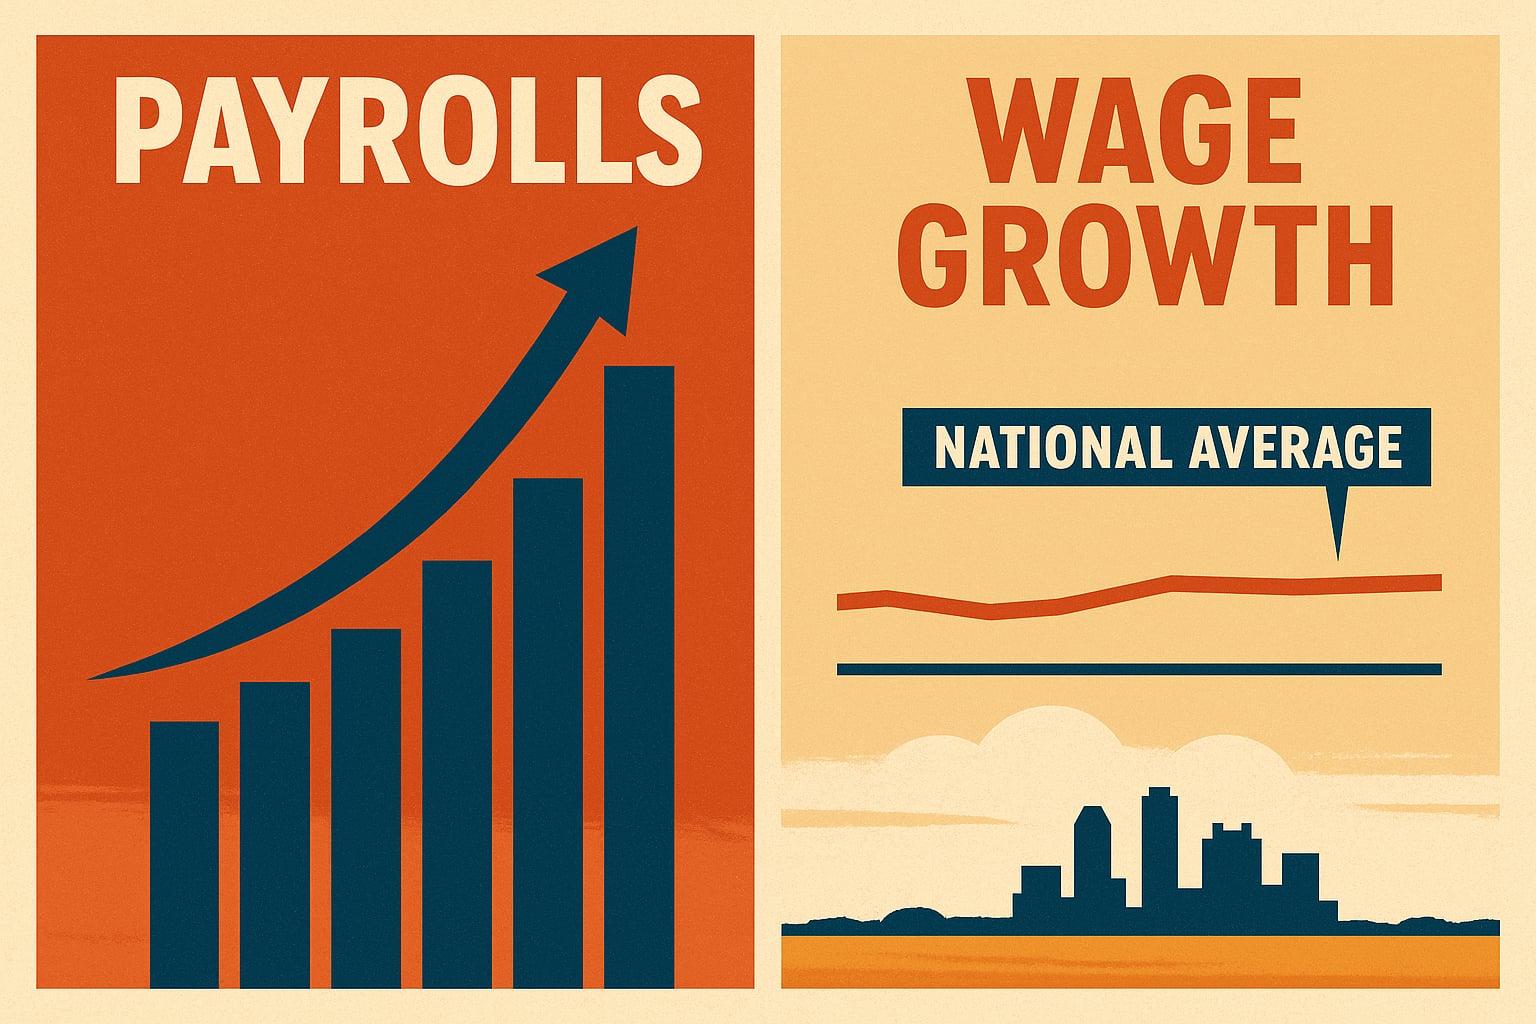
DFW payrolls rebounded to 41,900 jobs YoY in January 2026 while wages grew just 1.8% vs. 3.4% nationally — a split that reshapes recruiting and relocation calculus.
More Articles

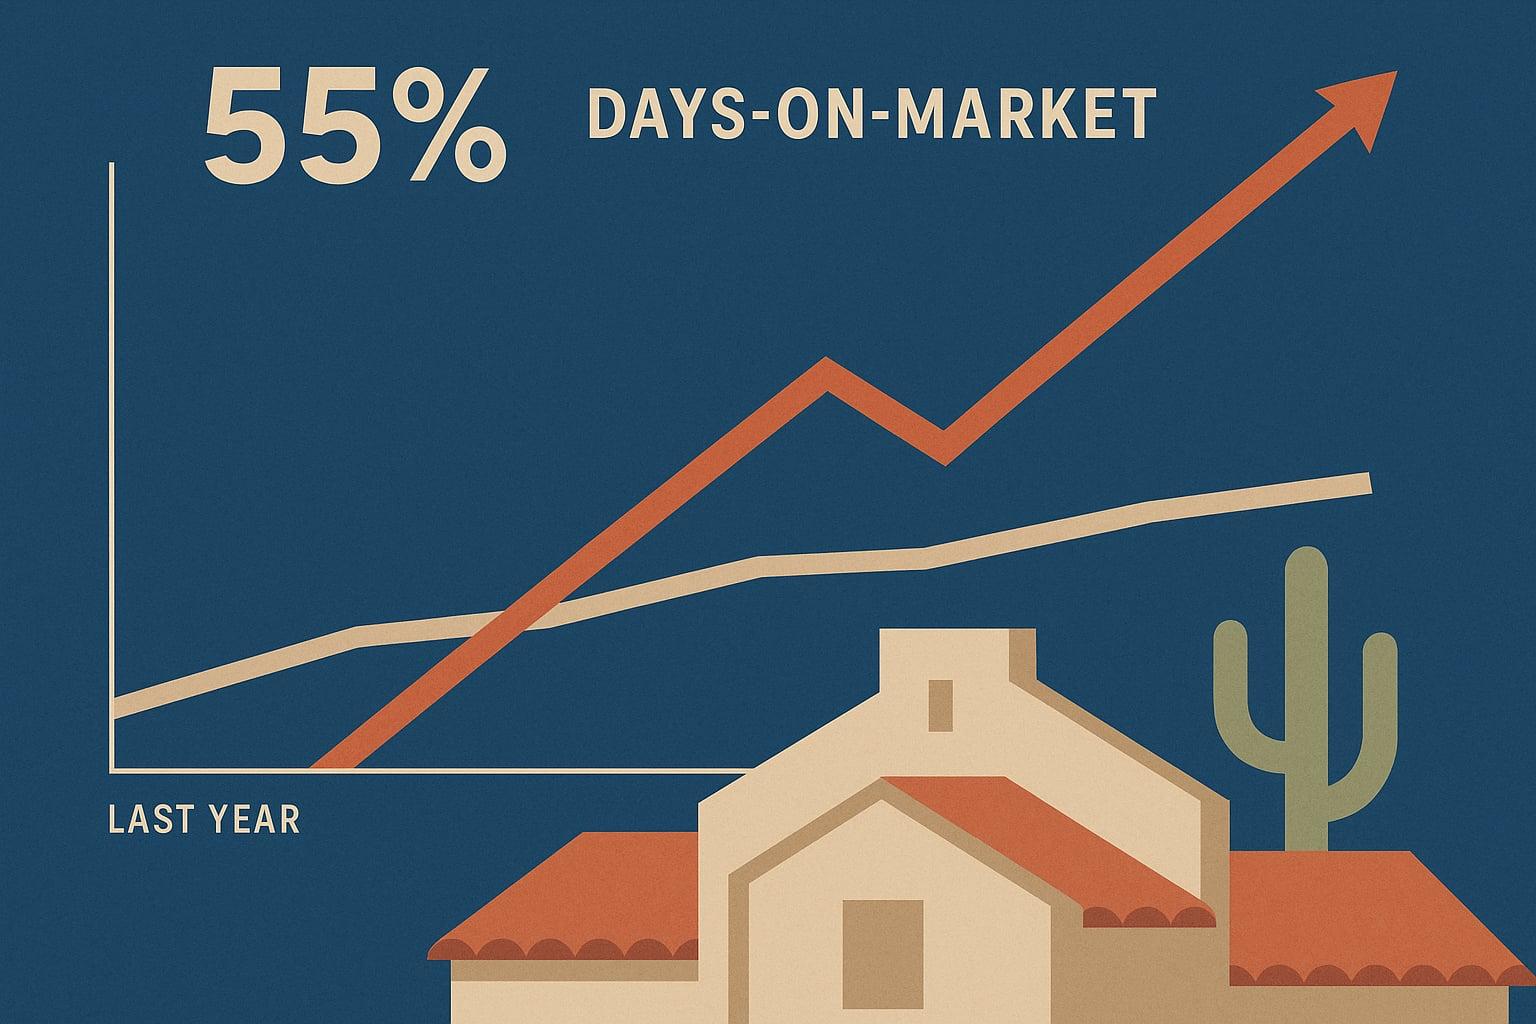
Phoenix homes averaged 82 days on market in April 2026, up 55% YoY from 53 days — here's what the widening ask-to-close gap means for investors.

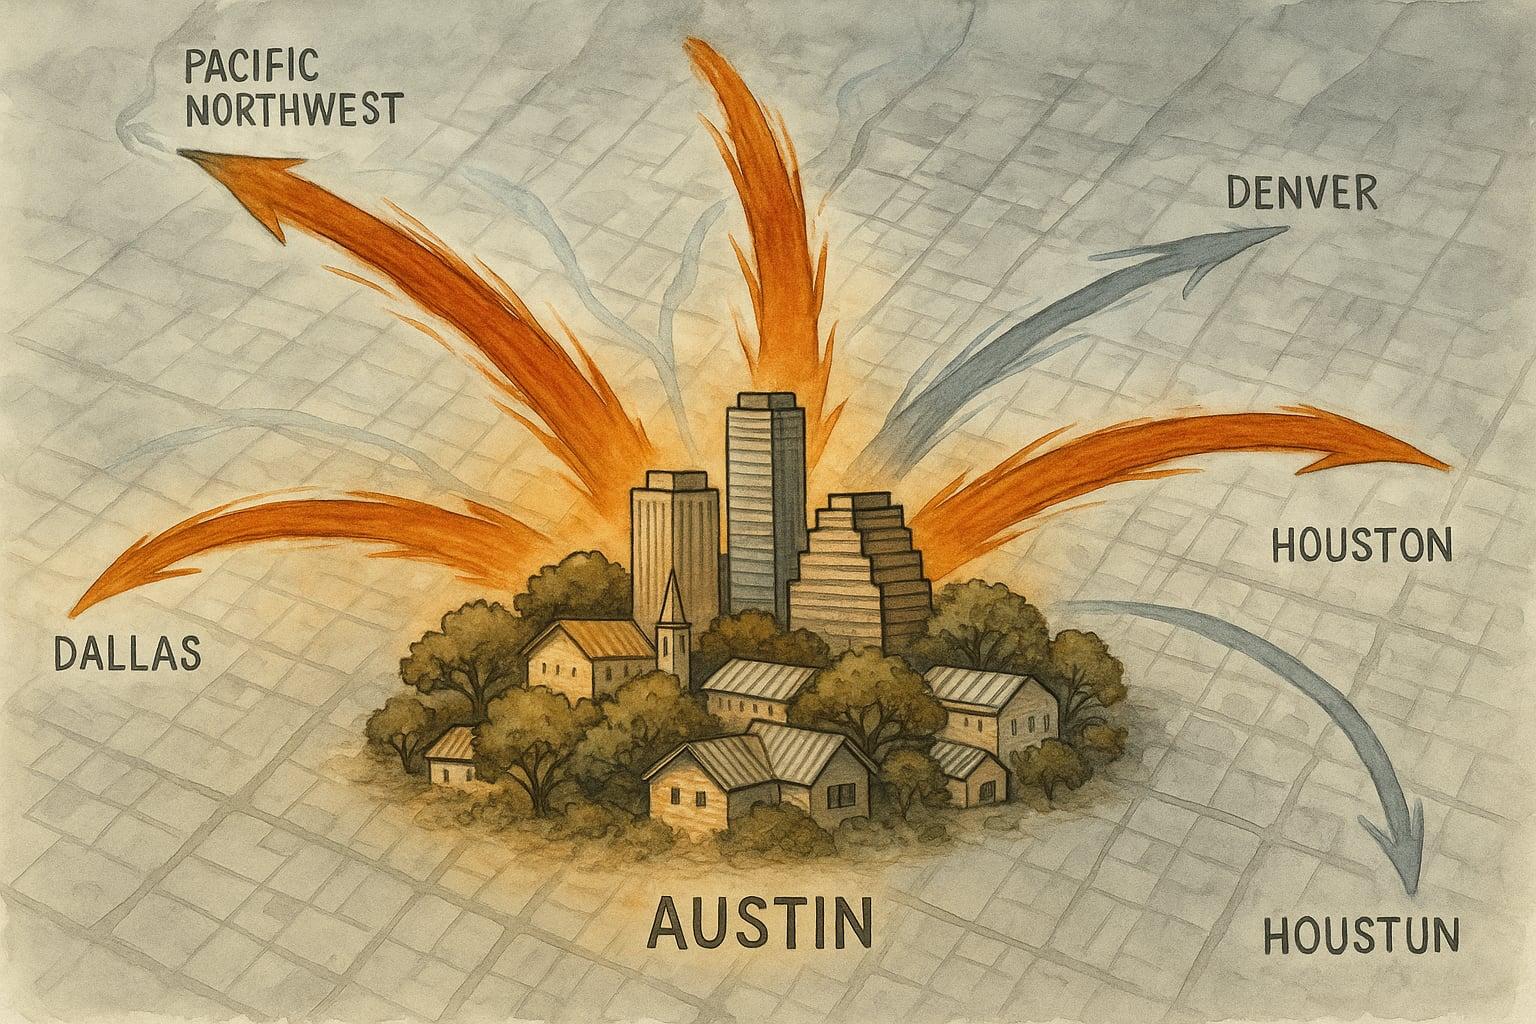
Austin flipped from top pandemic migration destination to net-outbound. Redfin Q4 2025 data shows the boomerang effect hitting supply and prices.

Phoenix's 5.2% YoY price drop is the cycle's steepest — but with closed sales volume rising and Zillow at $405K, the read isn't a crash.

The Phoenix housing market is splitting in two. Here's how to read the days-on-market gap by sub-market — and what it means for your leverage.

Jacksonville shed nearly two months of supply in a single quarter. Here's what the NEFAR, Houzeo, and FRED data actually show — and why the numbers diverge.

See the best school districts in San Antonio by 2025 TEA rating — and how A–F grades map to zip codes and home prices.

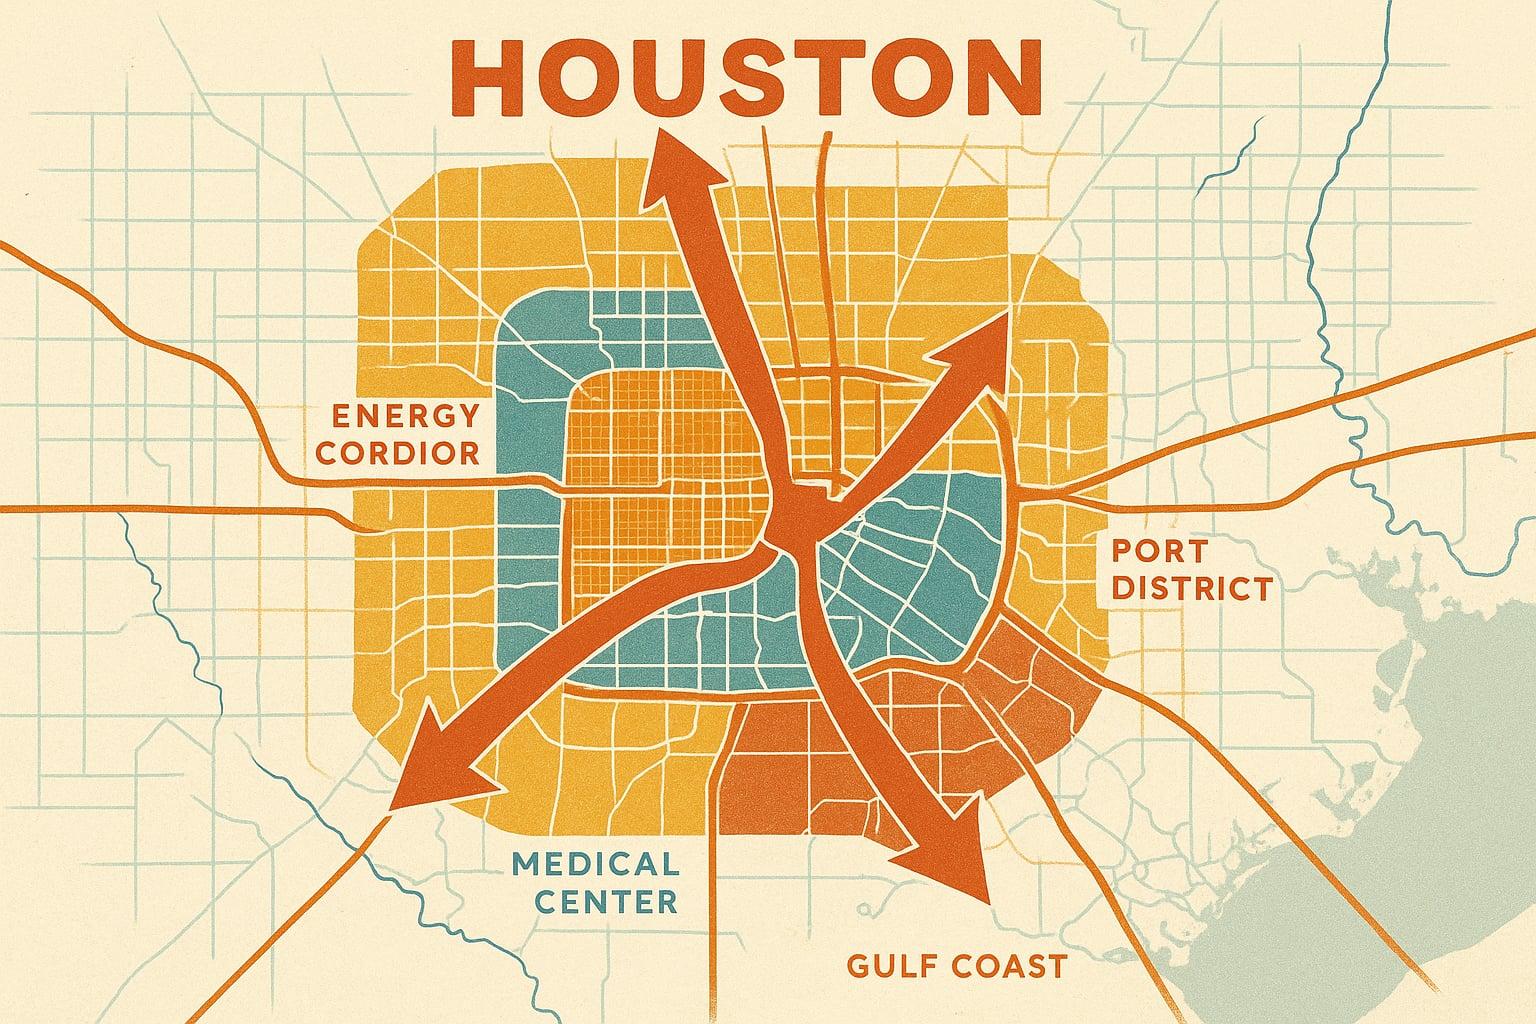
Hundreds of thousands of homes sit in Houston's FEMA flood zones. Here's what every buyer must know before closing — coverage, cost, and 2025 risk.

C2ER data puts Raleigh's overall cost of living roughly 3% below the national average — with housing and utilities also running below the U.S. norm.

Atlanta flipped from net domestic inflow to outflow in 2024 — a 30-year first. Here's what the data means for price trajectory and demand.

DFW claimed 11 net interstate HQ relocations in 2025, more than any other U.S. metro. Here's what the pipeline signals for white-collar housing demand.

Pew's March 2026 analysis documents a 19% real-terms rent decline driven by 120,000 new units, and Austin's vacancy surge tells investors exactly where the floor is.

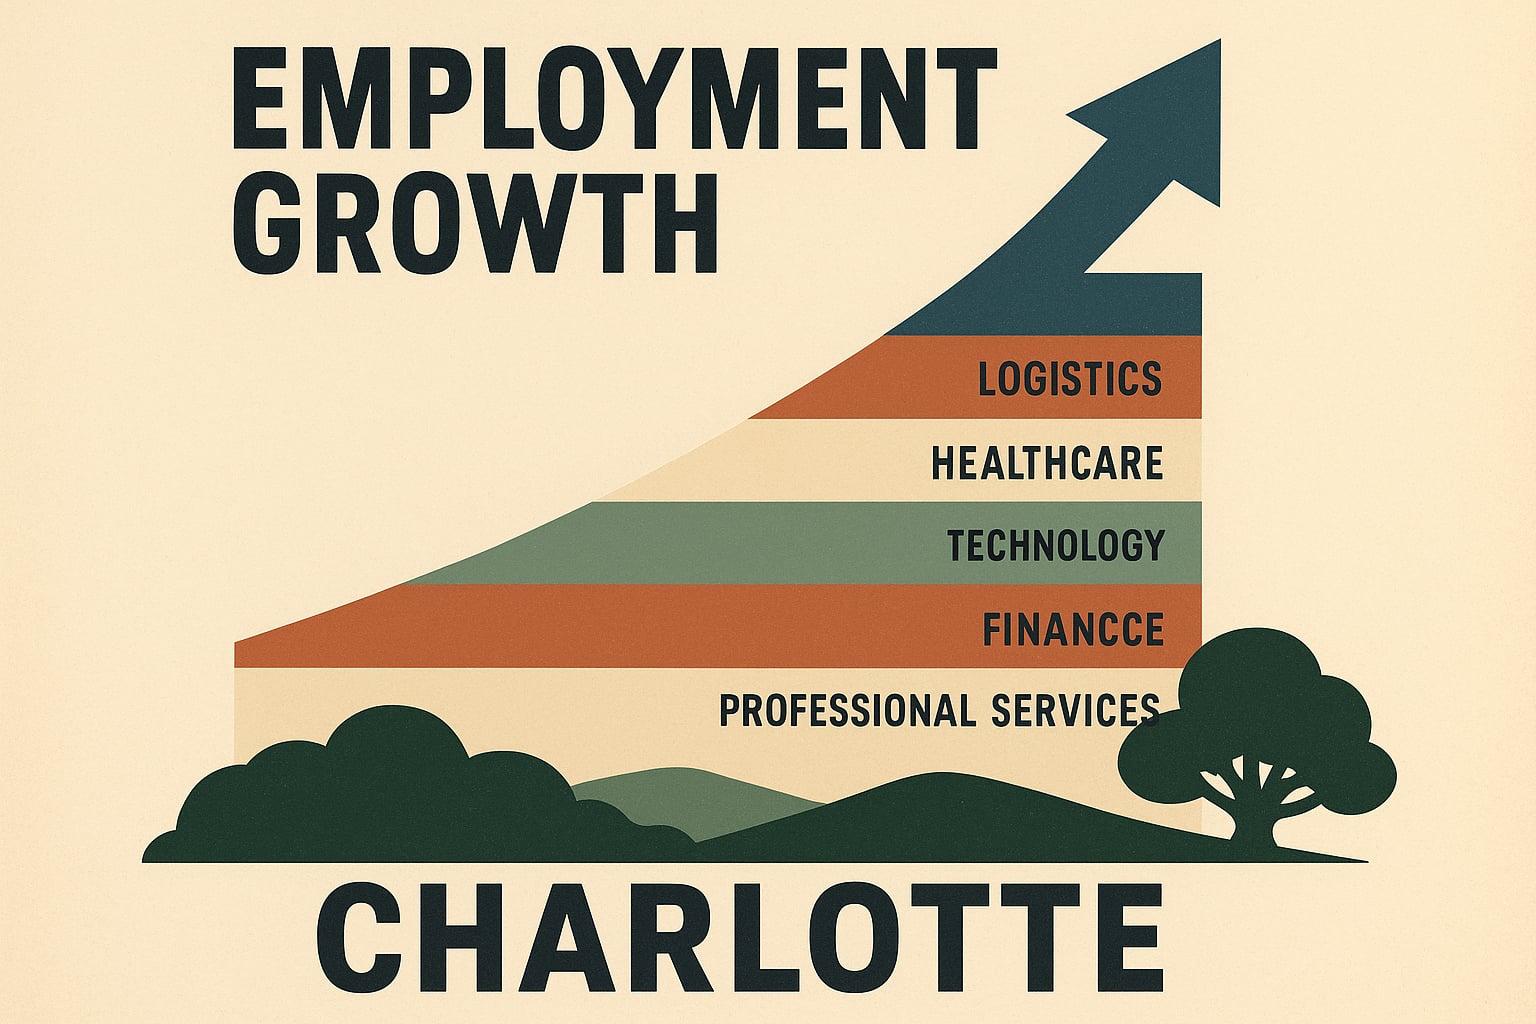
Charlotte led every large U.S. metro in nonfarm payroll growth at +2.7% YoY through December 2025. Here's what that means for housing demand.

Florida homeowners insurance is finally easing: Citizens hit a 14-year low and rate hikes collapsed from 21% to 0.2%. What it means for Tampa buyers.

Phoenix's net domestic inflow rose to 21,364 in 2024, a counter-trend gain as Tampa collapsed and Austin retreated. Here's what that means for inventory and price floors.

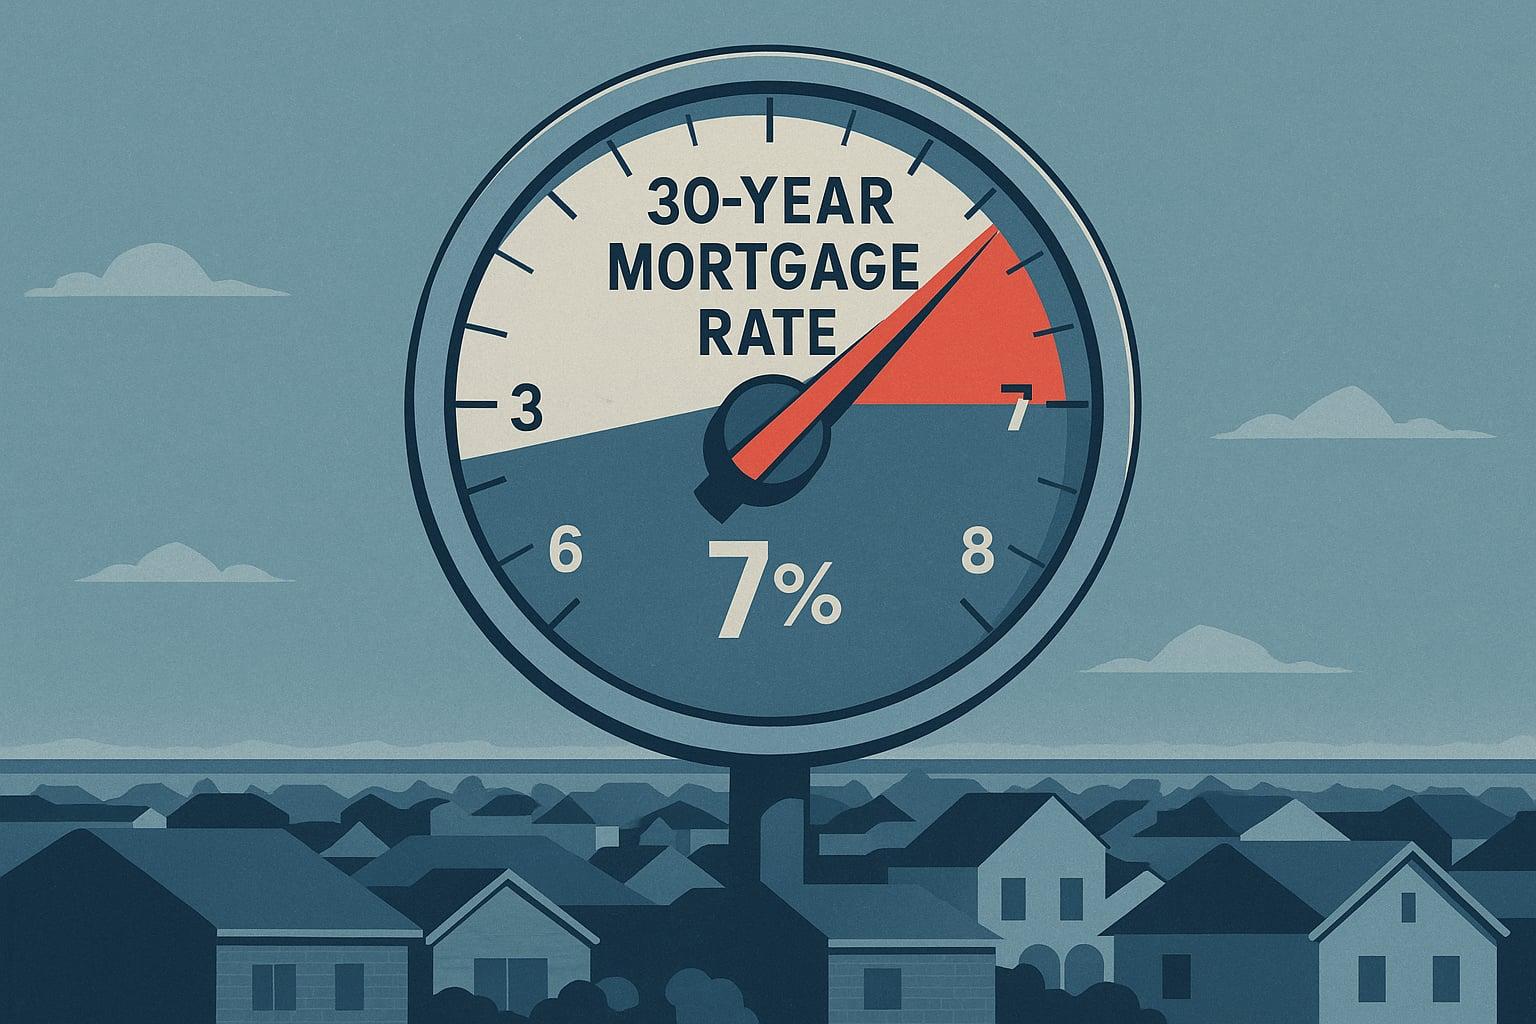
Monthly mortgage payments are running ~8.4% below year-ago levels, but income-to-payment ratios across Phoenix, Austin, Tampa, Charlotte, and Nashville reveal a structural affordability gap that rate cuts alone won't close.

AEI projects 0% to –1% in 2026, –2% in 2027 and 2028. Here's what that means in real dollars, and whether waiting pencils out across five Sun Belt metros.

Charlotte leads Sun Belt metros with 2.7% YoY job growth while Texas stagnates. Here's what the corporate relocation data means for housing demand and investment positioning in 2026.

Tampa's net domestic inflow fell ~70% in 2024, the steepest drop among the 50 largest U.S. metros. Here's what it means for inventory, prices, and the 2026 investment thesis.

AEI's HPA index signals YoY national price growth turns negative in April 2026. Here's how Phoenix, Austin, Tampa, Nashville, and Charlotte each sit in the correction.

Austin and Tampa are carrying elevated housing supply, well above the 4–6 month historical norm in key submarkets. Here's what the data means for pricing, yields, and 2026 positioning.

Nashville's active listing count has surged 192.69% YoY to 6,562 homes, pushing months of supply to 5.58. Here's what near-balanced conditions mean in dollar terms.

Phoenix is simultaneously a leader in price reductions and one of the few Sun Belt metros where domestic migration is still accelerating. Here's what that paradox means for buyers and investors.

Tampa leads the Case-Shiller 20-metro composite with 13 straight months of annual price declines. Here's the full data portrait of a market in structural repricing.

After three years of seller dominance, Phoenix inventory has crossed 3 months of supply. We break down what shifted, what neighborhoods offer the best opportunity, and what buyers should do now.

Charlotte's population growth machine is running at full speed, but housing permits haven't kept pace. We map the pressure points and the neighborhoods absorbing the overflow.

For many Tampa homeowners, annual insurance premiums now exceed property taxes. We break down the numbers by zip code and what it means for the market.

Austin home prices are down roughly 20% from their 2022 peak. We analyze whether this is a buying opportunity or whether more downside remains, and what the data says.

From mixed-use megaprojects downtown to master-planned communities in Williamson County, Nashville's development pipeline is unlike anything the metro has seen. Here's where the growth is.