Austin's Two-Speed Construction Market: Travis County Grows While Suburbs Pull Back in 2025
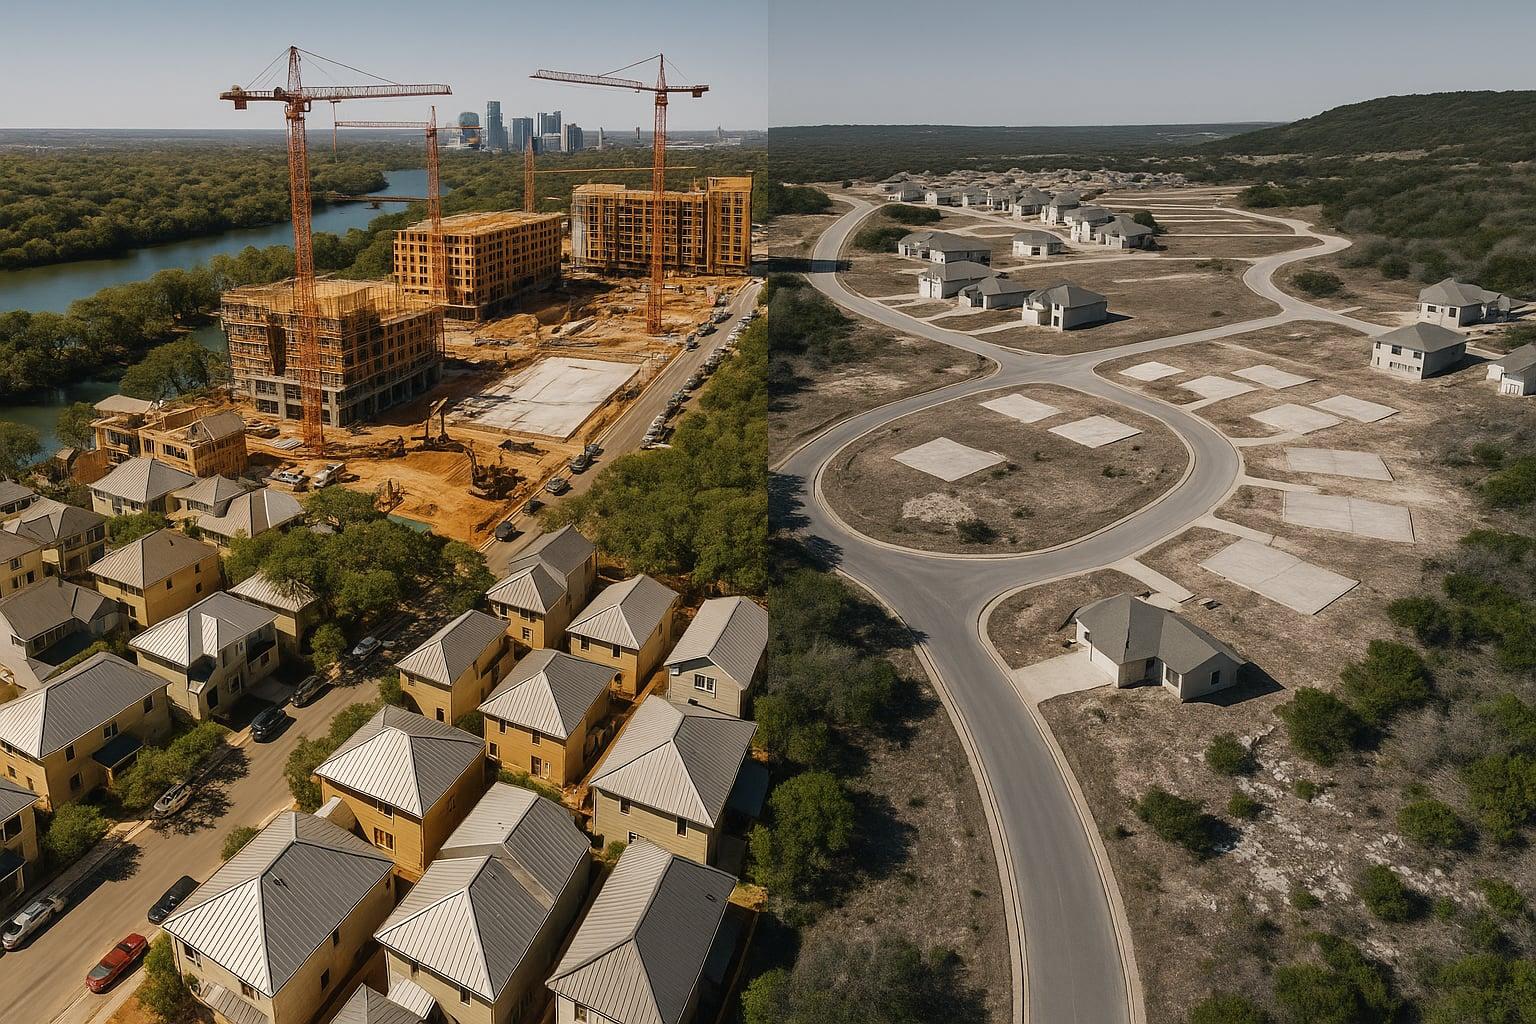
Over the past twelve months, the dominant headline on Austin construction has toggled between "boom" and "bust" depending on which data series the writer happened to open first. Both frames miss the story. The 2025 permit data, read at the county level, shows a market operating at two distinct speeds — and investors who track only the metro aggregate are reading the wrong map.
The Metro Number Conceals More Than It Reveals
Austin's residential construction market cooled only slightly in 2025, ending the year with approximately 7,275 new permits, a small 3% decline. (Source: HBWeekly Texas Residential Construction Review 2025) That figure reads as mild deceleration. But the aggregate conceals a sharp internal divergence, and the divergence comes down to geography.
Travis County Bucks the Suburban Trend
What stands out is the internal balance within the metro. Per the same HBWeekly review, Travis County (3,390 permits) actually posted a 5% increase in new permits, making it one of the few counties in Texas to exhibit growth this year, while Williamson County (2,609 permits) demonstrated a decrease of just over 6%. Round Rock, Pflugerville, Cedar Park — the suburban crescents that absorbed the pandemic relocator wave — are pulling back. The urban core is adding.
The pattern held through the year, with Travis County's permit growth accelerating into Q4 rather than fading, a sign builder confidence in the county was rising as the year progressed.
What drives suburban hesitation is straightforward. Higher mortgage rates compress the pool of buyers who can absorb a new-home payment in Williamson or Hays County, where lots are cheaper but price sensitivity among buyers is greater. Travis County's draw is different — infill sites, higher-income purchasers, and a city government that spent 2024 and 2025 actively engineering a faster path to a permit.
High-Value Construction Fills the Urban Pipeline
Despite the overall slowdown statewide and regionally, one segment of the market moved decisively in the opposite direction: homes valued at over $500,000. Across Texas, there were 9,155 new high-value permits (>$500K) in 2025, an increase of roughly 9% from the year before, and Austin led the urban-infill charge within that trend — the city's 929 high-value permits represented nearly 100 more such projects than the previous year, per the HBWeekly data.
The implication for the price gradient across the metro is direct. New inventory is concentrating in higher-cost urban zones. Buyers expecting new-construction affordability in the suburbs face thinning supply as starts slow; buyers drawn to urban Travis County face a pipeline priced at the upper end. Neither dynamic is invisible in the aggregate metro number, but both are obscured by it.
The Permit Review Bottleneck and the AI Fix
Faster urban production did not materialize from demand alone. Builders in Austin have long lamented the amount of time it takes for the city to review and approve plans for new construction. In 2022, it took an average of 345 days for developers to get a permit to build. (Source: KUT Radio / ConsumerAffairs, citing 2022 city audit)
The city's response was technological: in October 2024, following a successful three-month pilot, Austin contracted with Archistar to deploy its AI-powered automated building permit assessment software. José Roig, director of Austin's Development Services Department, described the intent directly: "With Archistar's platform, we will be able to provide faster and more informed feedback on building plans, and that's crucial in our journey to improve the development process." (Source: Archistar PR Newswire, October 9, 2024)
The timing matters. The AI review system came online at precisely the moment suburban builder appetite was softening — channeling the metro's remaining construction energy toward urban sites that benefit most from a faster municipal throughput.
Policy Tailwinds Behind Urban Density
The permit review upgrade is not the only force accelerating Travis County's numbers. Austin's HOME Act Phase 2 reduced the minimum single-family lot size from 5,750 square feet to 1,800 square feet and allows up to three units on most SF-3 lots — described as the most significant overhaul of Austin's Land Development Code in decades. That rule change, now in full effect citywide, widens the universe of infill sites that pencil out for developers. Austin City Council also approved sweeping new density bonus rules in May 2026, allowing developers to seek up to 60 additional feet of building height in exchange for on-site affordable units or community benefits.
Zoning reform and AI-assisted permitting, running in parallel, are structural accelerants. The suburban slowdown is largely cyclical. That asymmetry is what makes the Travis County trend durable rather than a one-year anomaly.
Suburban Pullback and the 12–18 Month Supply Clock
For investors tracking submarket supply, the suburban deceleration is the more actionable near-term signal. When builders reduce starts in a given corridor, the existing for-sale and rental stock absorbs demand without material replenishment. Williamson County already carried the tightest inventory across the metro at 4.2 months of supply as of May 2026, per Unlock MLS data — below the metro-wide average of 4.7 months. Cedar Park led suburban rental absorption at 36 days on market, followed by Pflugerville at 40 days and Buda at 41 days, per Doorstead's June 2026 report.
Suburban builder pullback, combined with already-thin inventory, sets up a tightening cycle in those submarkets within 12 to 18 months if demand holds at its current pace. Pending contracts across the metro were up 8.5% YoY as of early July 2026 (4,572 vs. 4,214), per Austin-area MLS data, a demand signal that has not yet been met with a commensurate supply response in the suburbs.
The FHFA Price Signal
The FHFA House Price Index for Austin shows a -0.8% YoY reading through the most recent quarter — modest price softness at the metro level that masks the directional divergence between urban and suburban submarkets. Travis County's median home price fell 3.9% YoY to just under $535,000 in May 2026, per Unlock MLS data, even as permit activity there accelerated. Higher-value new construction entering the Travis County pipeline puts upward pressure on median figures over time, even if current resale prices remain soft.
The single-headline read — "Austin construction is slowing" — is technically defensible but analytically incomplete. The question now is whether suburban builders return to the market before Travis County's infill pipeline plateaus, or whether the metro's new-inventory geography stays concentrated in the urban core long enough to meaningfully reprice the suburban supply advantage.
Investors and developers who parse the county-level data before Q3 2026 numbers arrive will have a meaningful timing edge on those reading only the metro aggregate.
Track permit trends and inventory shifts across Sun Belt metros with the SunBeltPulse newsletter. For Austin's broader correction context, see our related analysis: Austin Construction Boom vs. Rent Decline: A 2026 Case Study and AEI 2026 Affordability and Economy: Austin and Tampa Price Cuts.
This article was researched and drafted with AI assistance, fact-checked, and reviewed by an editor before publication — see our Editorial Standards. It is general information about real estate markets, not financial, investment, legal, or real estate advice; consult a licensed professional before acting. See our full disclosure.
More market analysis
Sun Belt Builder Retreat: Austin Down 25%, San Antonio Down 24% — What a 44-Month Permit Slump Means for Home Buyers
4 min read
New Construction vs. Resale in Tampa, Austin, Raleigh and San Antonio: Zillow Data Shows Where Builders Are Cutting Prices
4 min read
Austin's Pandemic Boomerang: What Redfin's Net Outbound Migration Data Means for the Housing Market
5 min read
Considering a move? Explore the full Austin market data — home prices, rents, jobs, permits, and population trends.
Beyond the calculator: see our full relocation toolkit — movers, agents, insurance, and city-test rentals.