Nashville's Suburban Population Boom: What Rutherford and Wilson County Growth Means for Families Relocating in 2026
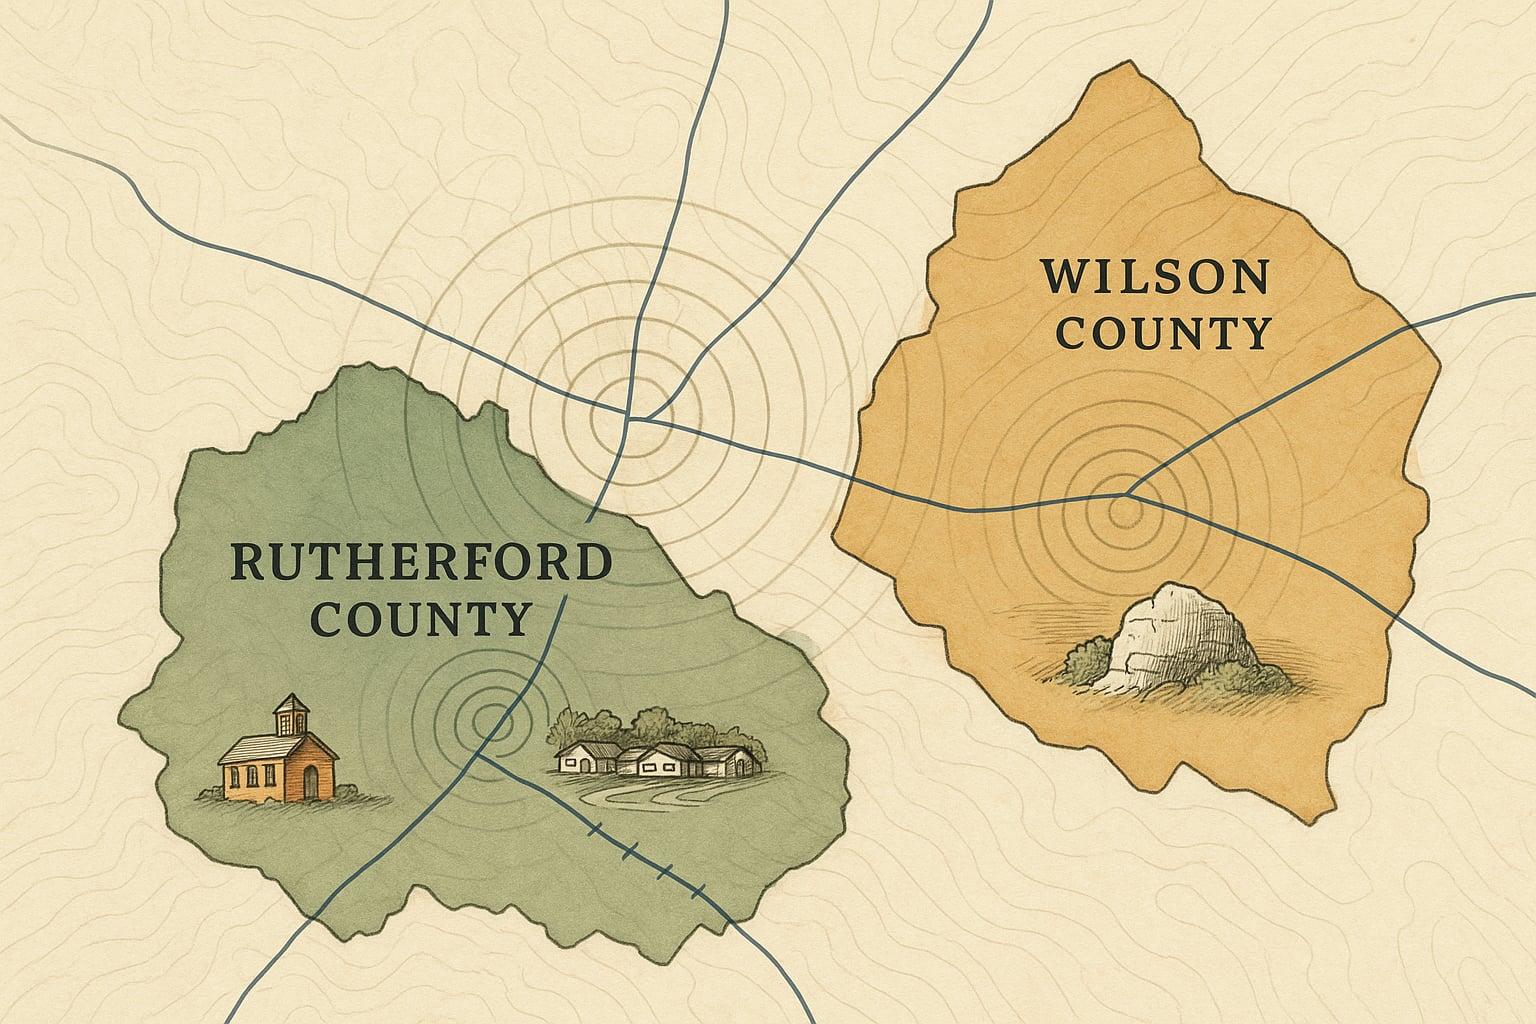
If you're relocating to Nashville with a family, the decision probably isn't Nashville or somewhere else anymore. It's which Nashville suburb — and the March 2026 Census data release makes that question a lot easier to answer.
Middle Tennessee's suburban ring posted some of the strongest population gains in the entire Southeast between April 2020 and July 2025. Rutherford County added nearly 45,000 new residents, a gain of more than 13%. Wilson County grew by more than 18%, adding around 27,000 people. Williamson County added more than 24,000. These aren't rounding errors in a fast-growing state — they're a structural shift in where Nashville-area families are choosing to land.
The numbers matter for your move. More growth means more competition for homes, more strain on schools, and, in some corridors, more new construction to choose from. Here's how to read the data before you commit.
Why the Nashville Metro Keeps Drawing People
Nashville continues to capture a disproportionate share of Tennessee's domestic in-migration. No other Tennessee metro comes close.
Tennessee has no income tax on wages, and housing prices remain well below coastal benchmarks. Those two facts explain a lot. Families priced out of major coastal metros find that Middle Tennessee offers a comparable quality of life at a fraction of the cost — IRS Statistics of Income state-to-state migration data consistently show California and Illinois among the leading origin states for Tennessee in-migrants.
Domestic migration added 42,389 new Tennessee residents in the most recent annual period tracked by the Tennessee State Data Center — about two-thirds of the state's total population gain. The Nashville suburbs are absorbing the largest share of that flow.
Rutherford County: High Growth, Real Affordability
Rutherford County has led Tennessee in annual population increases for multiple consecutive years, according to WGNS Radio's reporting on Boyd Center for Business and Economic Research data. Murfreesboro, the county seat, sits about 35 miles southeast of downtown Nashville along I-24, putting it within commuting range while keeping prices measurably lower than Davidson County.
The trade-off is real: that commute can lengthen significantly during peak hours. If one or both of you will be in a Nashville office most days, map the specific route at 8 a.m. before you buy.
On the school side, Rutherford County Schools has grown rapidly alongside the population. That growth has brought infrastructure pressure — new schools are being built, but capacity lags enrollment in some zones. Request current enrollment figures and boundary maps directly from the district before closing on a home, since zone assignments can shift as new buildings open.
Wilson County: The Fastest Percentage Gainer
Wilson County posted the fastest percentage growth among the major suburban counties, adding more than 18% to its population since 2020. Its largest city, Mt. Juliet, anchors a corridor along I-40 that puts downtown Nashville about 25 miles to the west — a shorter drive than Murfreesboro for many buyers.
That geography is a meaningful advantage. Mt. Juliet and the Lebanon area have drawn buyers who want suburban scale without the longer Rutherford commute, and new residential construction has followed demand into the county.
The school picture in Wilson County is evolving. Redistricting discussions and portable classroom additions have accompanied the enrollment surge, according to Wilson County Schools. Before you zero in on a specific neighborhood, call the district to confirm which school your address feeds into and whether that school is currently at or near capacity.
Zone boundary note (applies to both Rutherford and Wilson counties): School zone assignments shift as new buildings open and redistricting occurs. Always confirm your specific address with the district's enrollment office before closing — do not rely on maps that are more than a few months old.
Williamson County: The School Premium is Real
If school ratings are your primary filter, Williamson County is the benchmark. Williamson County Schools posted an ACT composite of 25.3 for the Class of 2025, compared to a Tennessee state average of 19.3, according to the district's report card citing Tennessee Department of Education data.
That performance comes with a price premium baked into every listing. School zone assignment consistently ranks among the top factors driving home prices in the county, and the gap between the county's most and least sought-after school zones is meaningful. You're not just buying a house — you're buying access to a specific school boundary.
Williamson added more than 24,000 residents over the same five-year period, and redistricting conversations are active here too. The district confirms that zone assignments can shift when a school reaches capacity or when new buildings open. Check your specific address against current boundary maps, not the ones from two years ago.
What the Permit Data Tells You About Supply
More buyers chasing limited inventory is the compressed version of what's happening in all three counties. Nashville MSA building permit activity has pulled back from its post-pandemic peak, per U.S. Census Bureau Building Permits Survey data, via FRED. That metro-wide cooling is worth noting: even with sustained demand, new construction authorization has moderated significantly from 2021 highs.
Nashville-area home prices remain above their pre-pandemic baseline and mortgage rates remain elevated — check current FHFA and Freddie Mac data for up-to-date figures before modeling a payment.
Nashville delivered an estimated 8,900 to 11,000 new apartment units in 2025, down from a peak of approximately 14,700 in 2024, according to industry trackers including Northmarq and Yardi Matrix. That rental supply has helped moderate rent growth in Davidson County, which can be useful if you need to rent first and buy later — a reasonable strategy when you're still learning the suburb boundaries.
How to Research Schools Before You Buy
This is where many relocating families lose time. Here's a short checklist that works for any of the three suburban counties:
- Confirm the zone, not just the county. Call the district's enrollment office with the specific address. Online zone maps lag official updates.
- Ask about capacity. Request current enrollment versus building capacity for the school your address feeds. A school at 110% capacity is a redistricting candidate.
- Check portable classroom presence. Districts use portable additions as short-term fixes during growth surges. They signal a school that has exceeded its designed footprint.
- Look at the Tennessee Department of Education's accountability data. School-level scores are updated annually and searchable by district.
"The nation's largest counties like those in the New York metro area are often international migration hubs, gaining large numbers of international migrants and losing people that move to other parts of the country via domestic migration," Census Bureau demographer George M. Hayward noted in a statement on the most recent population release. For Nashville's suburbs, the reverse is true: domestic in-migration is the primary driver, and it's concentrated in the counties with the best-rated schools and the most buildable land.
The Bottom Line for Both of You
If you're the one running the spreadsheet, here's the framework: Rutherford gives you the most affordability relative to Nashville proper, Wilson splits the difference on commute and price, and Williamson costs more but delivers the district performance data to justify it. The Nashville vs Charlotte cost-of-living comparison can also help calibrate how Middle Tennessee stacks up against other Sun Belt alternatives you may be weighing.
If you're the one thinking about the kids' school and the feel of the neighborhood, here's the honest read: all three counties have genuine community character and access to Middle Tennessee's outdoor spaces, food scene, and airport. The difference is how much growth-pressure friction you're willing to absorb. Wilson's Mt. Juliet corridor still has room to breathe. Williamson's most desirable zones are tight.
Start by getting pre-approved at today's rates so you know exactly which price band opens up in each county — use a mortgage calculator to run the numbers before you fall in love with a specific zip code. Then request current school capacity data from the district before you schedule showings. Those two steps will save you more time than any amount of browsing listings.
This article was researched and drafted with AI assistance, fact-checked, and reviewed by an editor before publication — see our Editorial Standards. It is general information about real estate markets, not financial, investment, legal, or real estate advice; consult a licensed professional before acting. See our full disclosure.
More market analysis
Nashville's Corporate HQ Boom: What Oracle, AllianceBernstein, and Amazon Mean for Housing Demand in 2026
5 min read
Fed Raises Rates for the First Time Since 2023: What Sun Belt Homebuyers and Investors Need to Know
5 min read
Charlotte and Nashville Are Now the Sun Belt's Top Corporate Relocation Magnets — What It Means for Housing
7 min read
Considering a move? Explore the full Nashville market data — home prices, rents, jobs, permits, and population trends.
Beyond the calculator: see our full relocation toolkit — movers, agents, insurance, and city-test rentals.